Pre-observability

Imagine you’re trying to find your way around an unfamiliar city.
Let’s say you have an objective that’s between one and three kilometers from your starting point (you’ll know it when you see it). How do you find it in a reasonable amount of time? Well, first of all it’s important to avoid going in circles, so you’ll probably want to remember particular street names and intersections and landmarks. You might also study the connectivity of the grid, and use its structure to narrow your search – are there only one or two ways across that river? That’s important! Or maybe you know something about the kind of objective you’re looking for, and can make inferences from your surroundings about whether you’re getting closer or farther (a skyscraper is probably not in a residential neighborhood).
Whichever approach you choose, I think you’ll agree that all of them are harder if you have to keep your eyes closed.
We’ve known since we started Antithesis that data analysis problems are much easier if we can make use of the highly-tuned convolutional neural nets we all carry around inside our skulls. That’s one reason we began our research with Nintendo games – the state spaces of these games are actually harder to navigate than those of most software systems, but they’re vastly easier to visualize, and that makes research on them more tractable and fruitful.
I can draw a scatterplot of all the points Antithesis can reach in Zelda, but how do I project the state space of a collection of microservices into two dimensions? And how do I let you explore the results? We’ve struggled with this challenge for the whole history of the company. Finding out what the “dimensions of interest” are in an arbitrary software system is possible with some high-flying machine learning, but the resulting “map” is anything but intuitive to a human being trying to understand what we’re doing to their software.
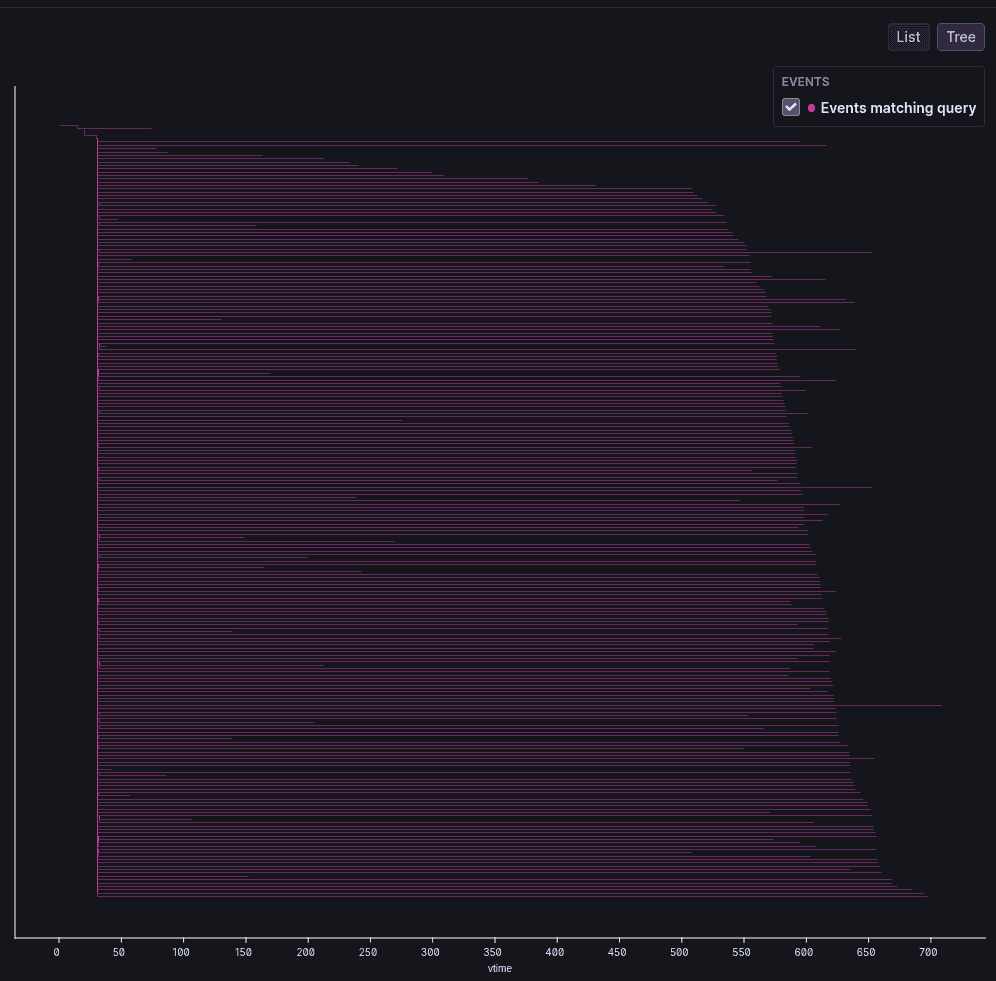
An alternative approach is to forget about “embedding” the state space, and just directly visualize how Antithesis explores it. Instead of some weird projection, we get a direct representation of the tree of execution paths Antithesis explores.

This has some immediate benefits:
- it’s concrete and easy to understand.
- it shows you what Antithesis is doing, which can immediately turn up setup mistakes and deficiencies in how your test is running.1
But it also has a big downside: it’s hard to tell from a view like this how well or thoroughly your tests are exploring the cases that you care about. We need another ingredient…
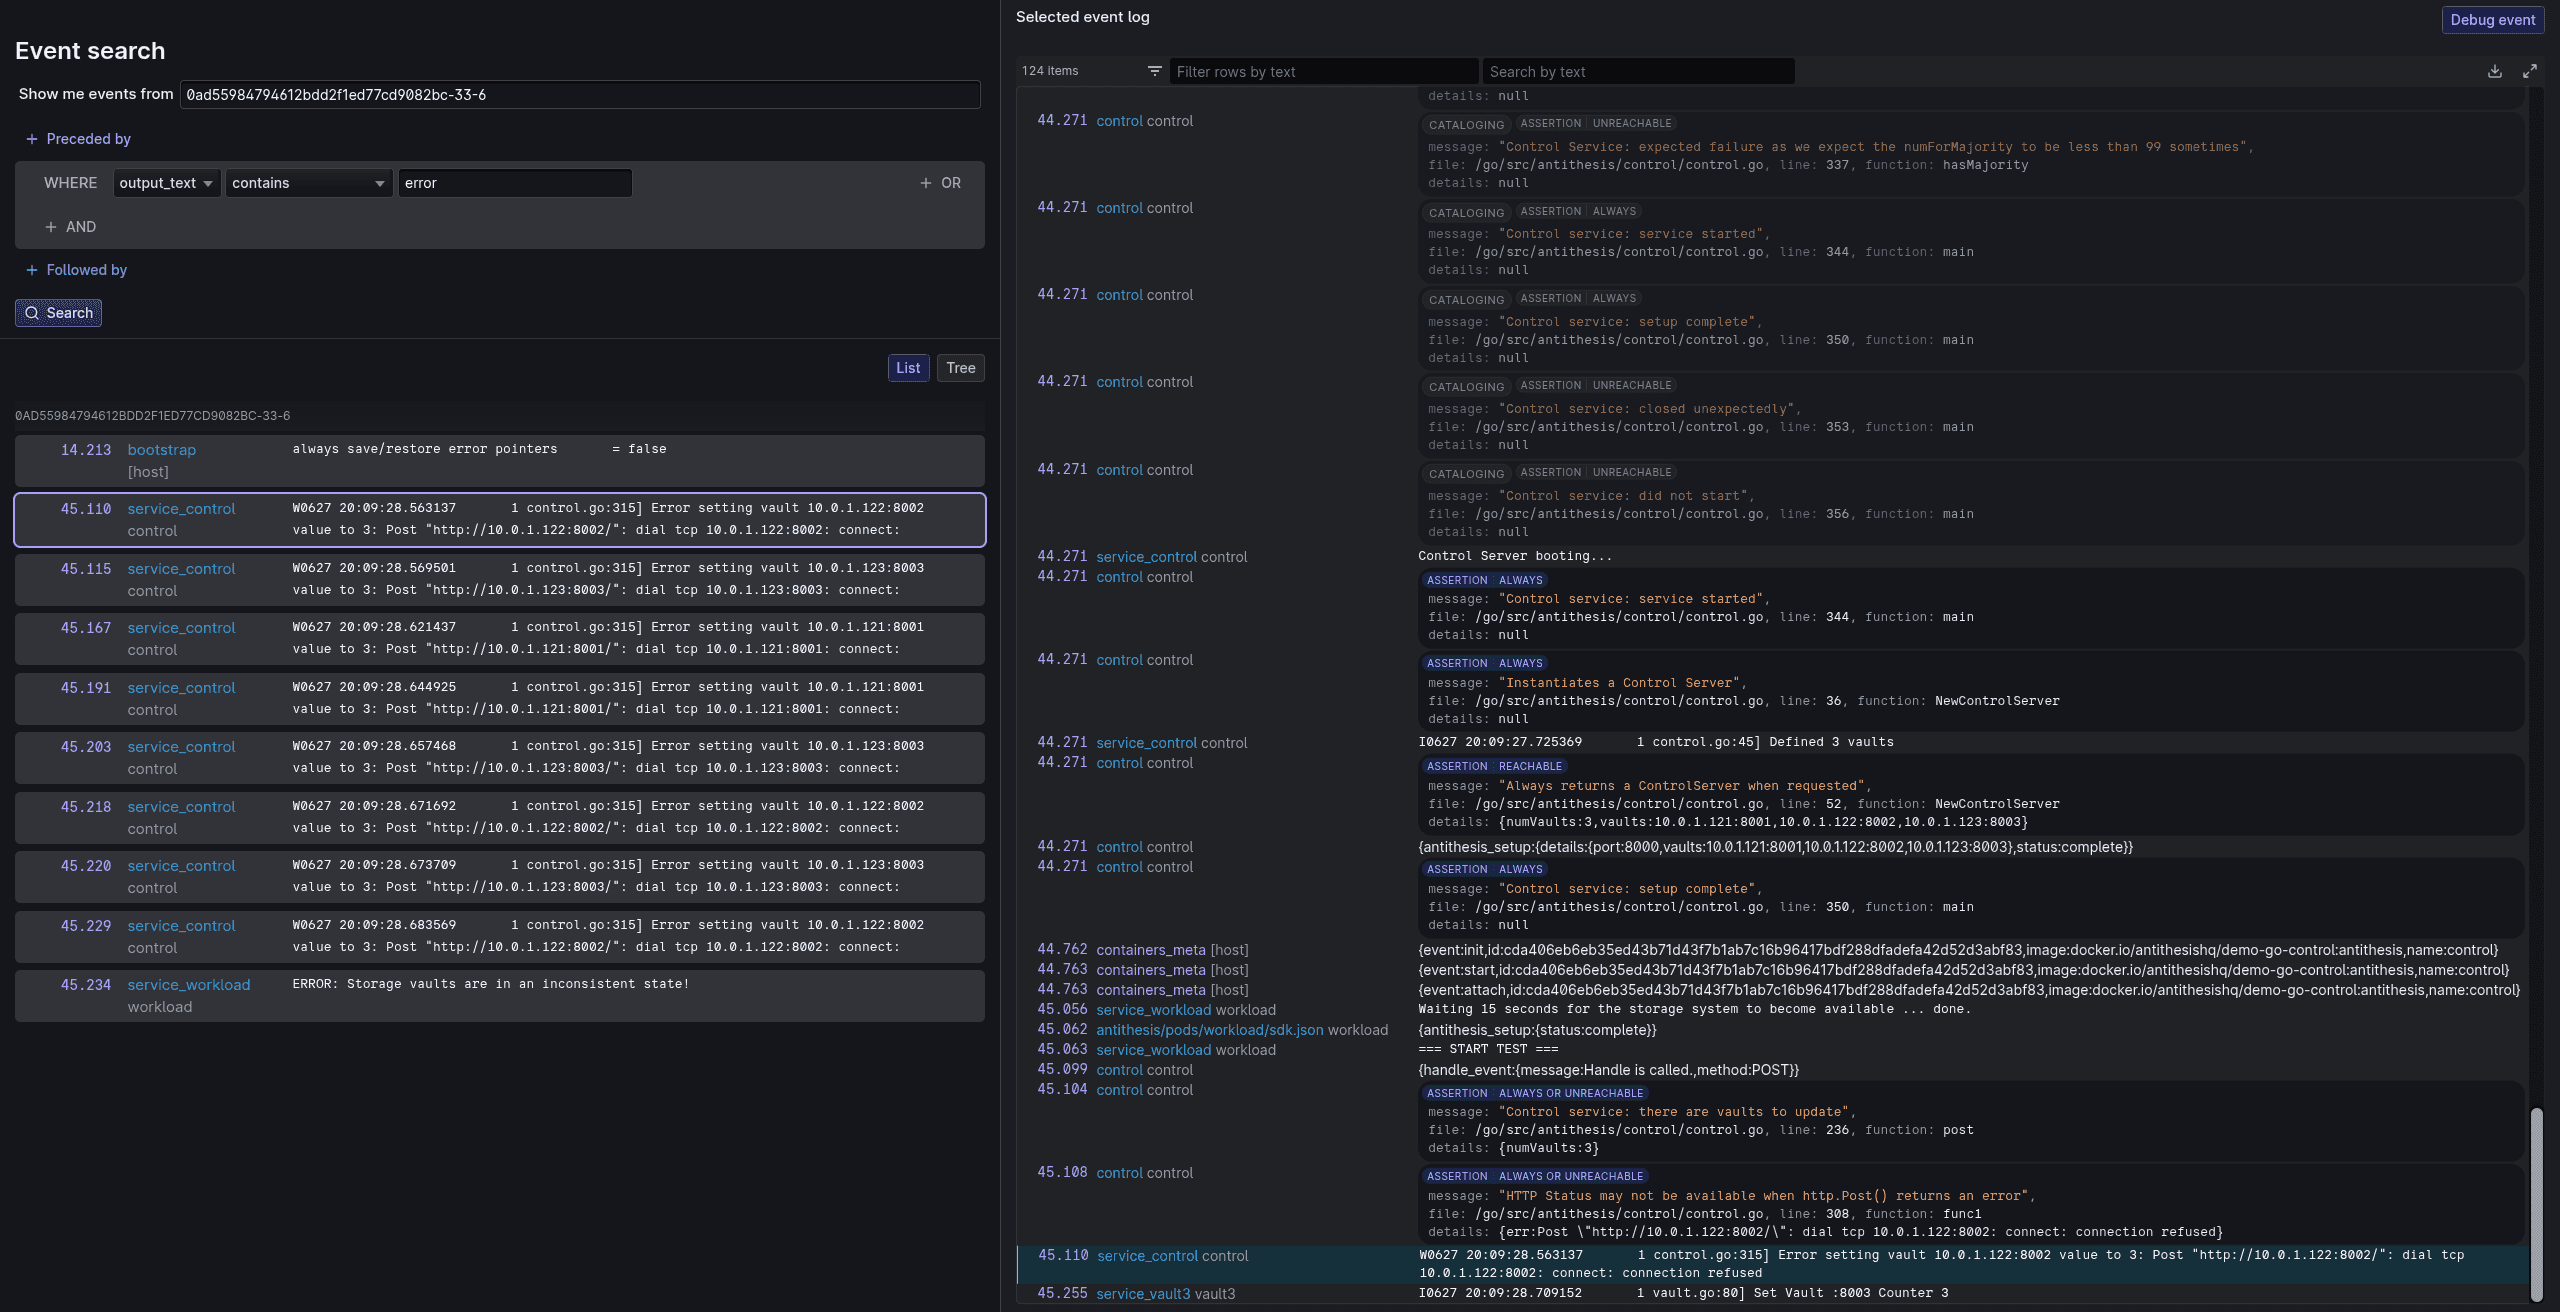
Which, fortunately, we already have, because testing and observability are closer than most people think. As we run your system through a multiverse of possible histories, we’re building an incredible dataset that tells you about how your system behaves under stress. This looks a lot like another dataset you already work with every day: the production data in your observability system. Rather than force you to declare ahead of time what constitutes a bug, why not give you the power to query your test data like you query observability data?

This “pre-observability” has a lot of benefits over traditional observability. By doing your log spelunking in a simulation instead of reality, you can identify and resolve issues long before customers see them. Our intelligent fuzzing and fault injection means you’ll likely get years worth of operational outliers in a single test run. Our deterministic simulation means any error, no matter how rare, can be reproduced. And determinism also means you can massively reduce your cloud storage costs, because you can jump back into any interesting situation and enable debug logs just in time (lucky you!).2
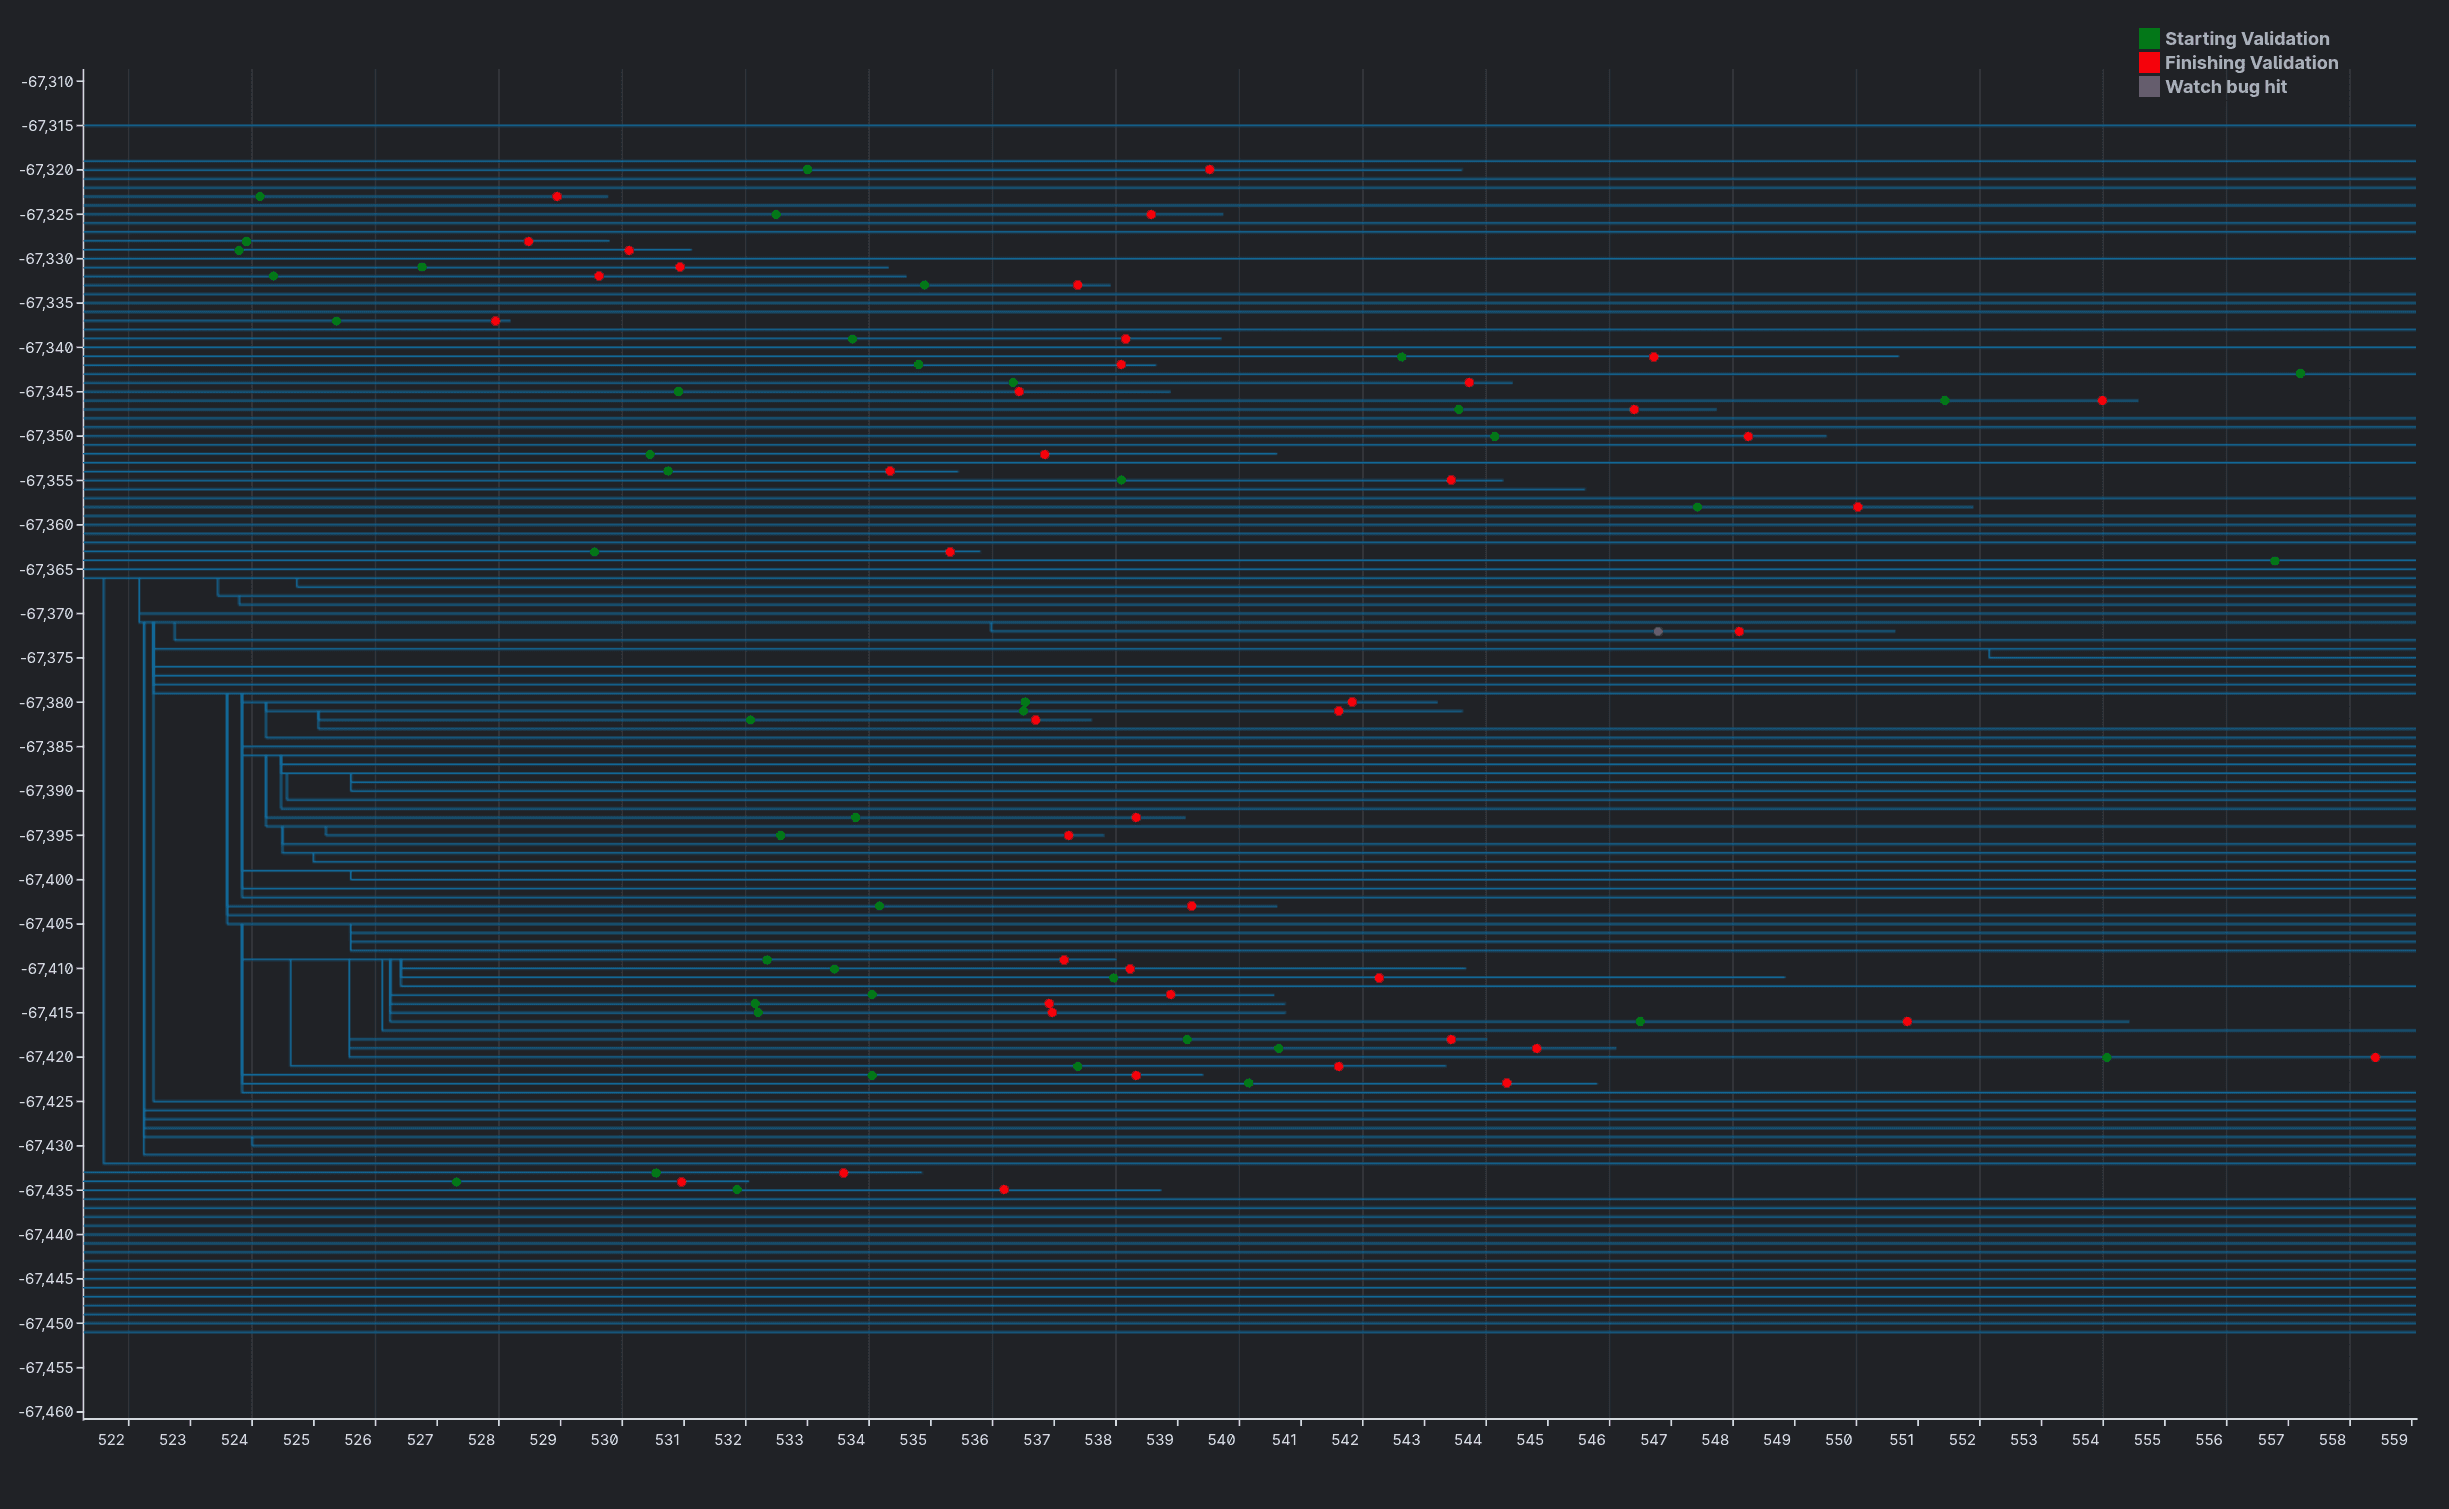
But it also provides the key to making the tree visualization above truly useful. If you’re searching your test results for evidence that a leader election has occurred, we can just go ahead and plot every instance of a leader election across every timeline in this multiverse. Now you can see all kinds of things about their distribution – do they only happen in a particular branch of the multiverse? Or across all branches but only at a particular time? Rather than plot the dimensions Antithesis found interesting, we put the flashlight in your hands, and drive the visualization using the observability-style log queries that you do.

Best of all, thanks to some backend improvements we can now do this in real-time, with new events streaming in as your test runs. In the long-term, we expect to enable you to evaluate arbitrary predicates (like whether we’ve found a bug yet) in real-time as well; but for now you can just start searching and visualizing as soon as your tests begin running. This is available to all of our customers today. Happy testing!


