Exploring the multiverse
When you test with Antithesis, we run your software many times to find unexpected behaviors in your code. The Logs Explorer and the multiverse map allow you to visualize and search across this multitude of execution paths, empowering you with a deeper understanding of what’s happening in the system under test. With the Logs Explorer you can:- Investigate production events in a powerful simulation
- Visualize when and where events occur in a test run
- Improve your testing by identifying gaps
For each simulation hour within the Antithesis environment, Antithesis will provide two hundred (200) megabytes of searchable log storage and container image storage for a customer for six (6) months.
Launching the Logs Explorer
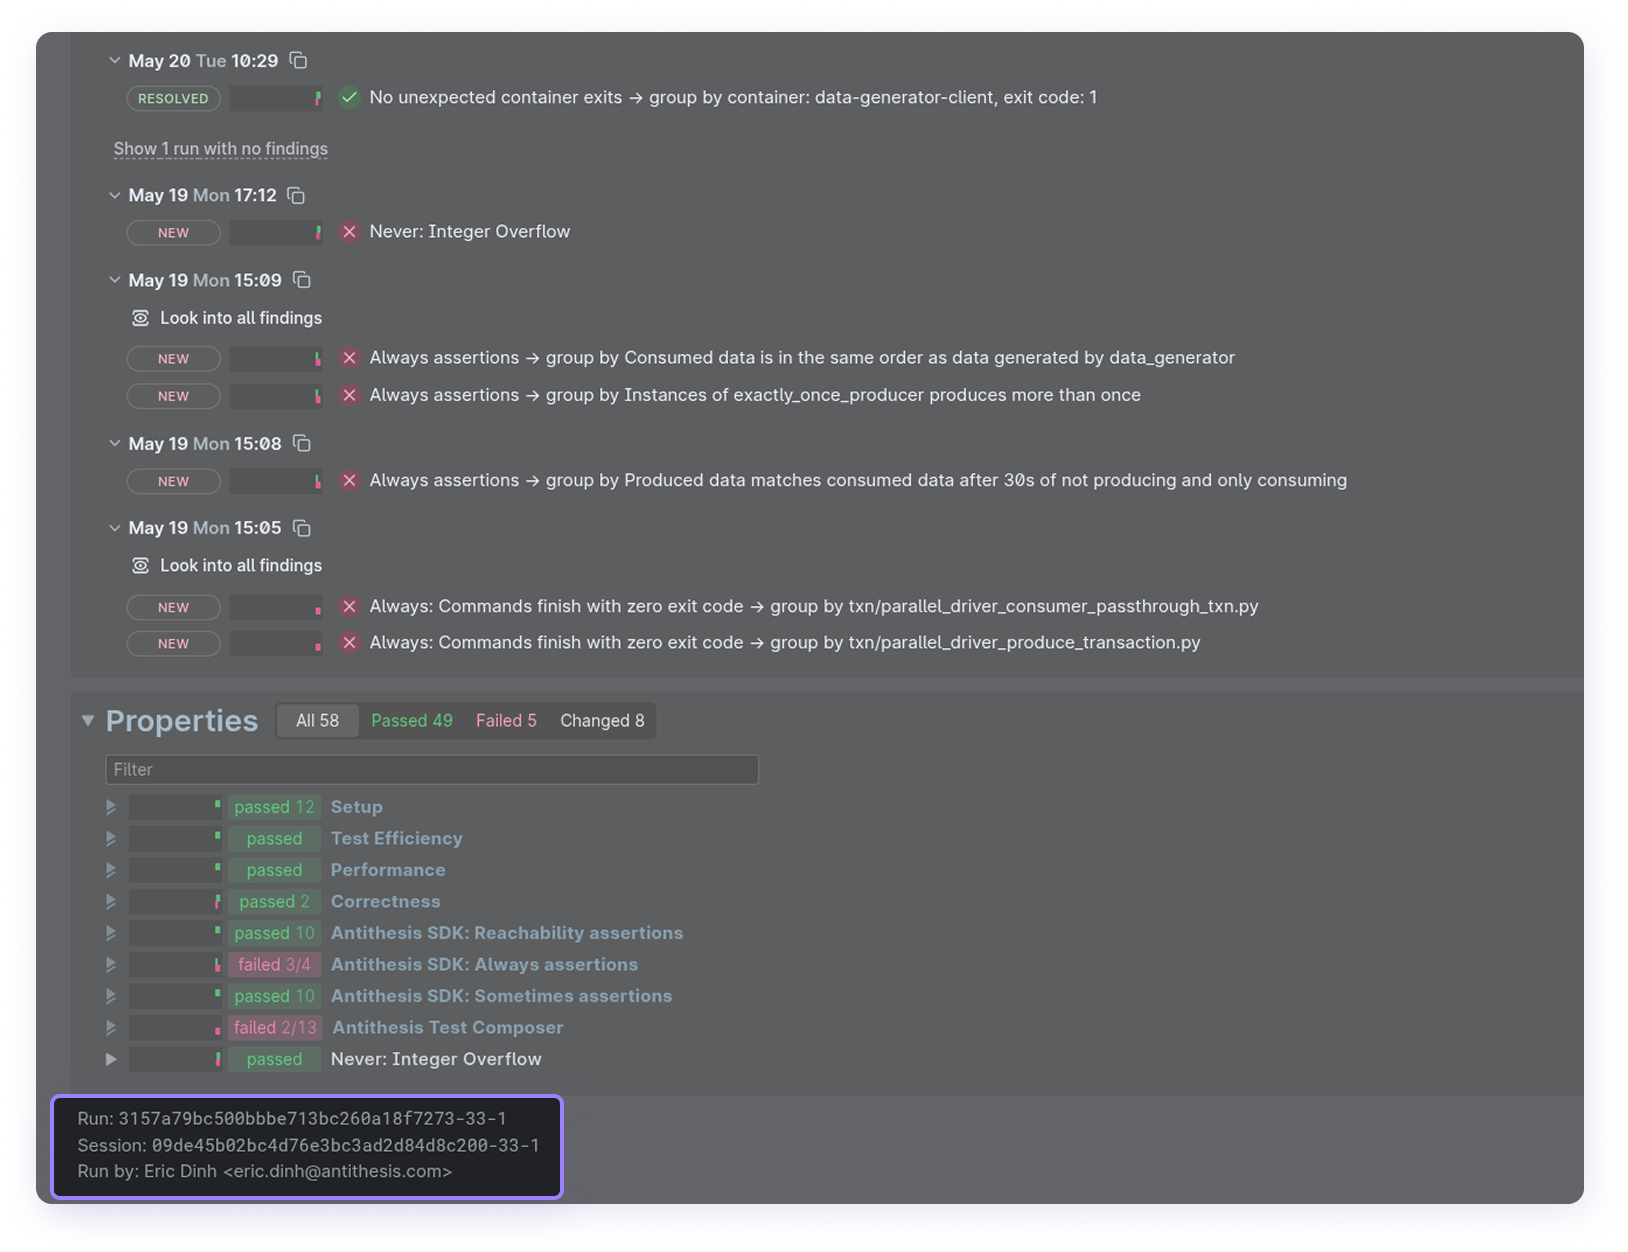
Every triage report contains an “Explore logs” button that launches a Logs Explorer for that test run. Alternatively, you can always go to<tenant>.antithesis.com/search and enter the session ID for a particular run – the session ID is at the bottom of each triage report.
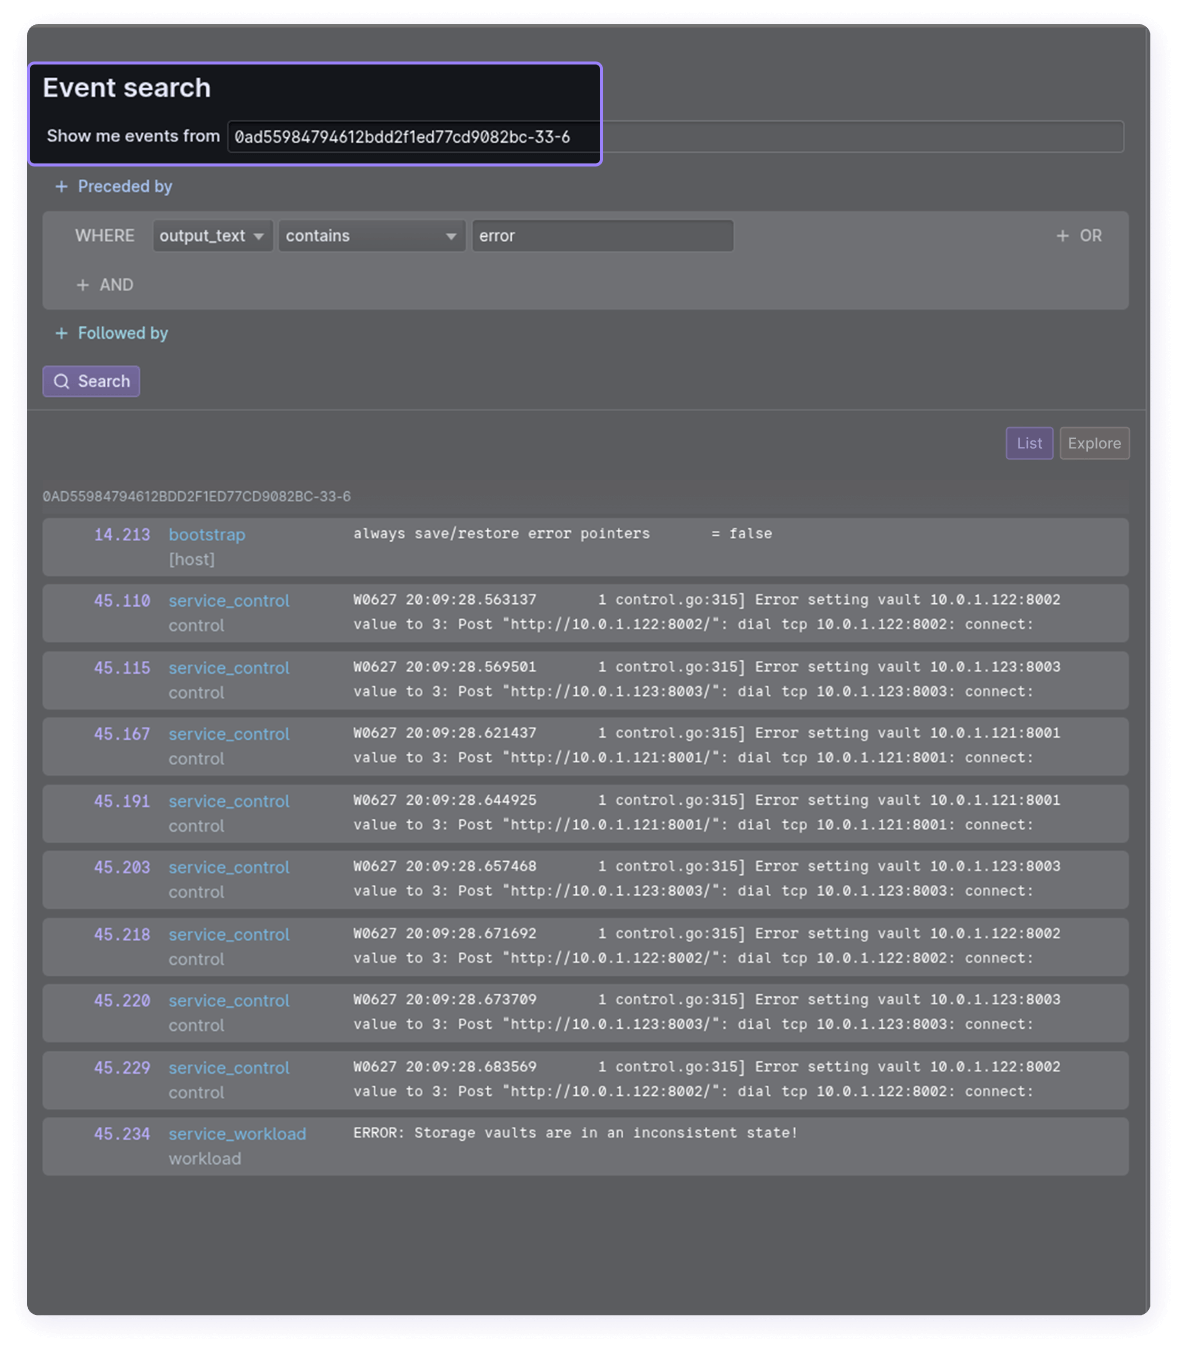
Event search
The Logs Explorer includes a search interface for events and a log viewer. You can:- Search the multiverse for any event: literal text, regular expressions, numbers, or booleans for any fields produced by the test run. You can also
- Search for a set of events using logical search patterns and temporal queries — event X but only when preceded by event Y.
Search performs some convenient type coercions to assist with event matching.
falsematches0and vice versa; same fortrueand1.- Numbers are standardized:
17.0matches17,-.50matches-0.5, etc. - Events missing the field being searched will be ignored, even when using negative operators, e.g.,
not contains.
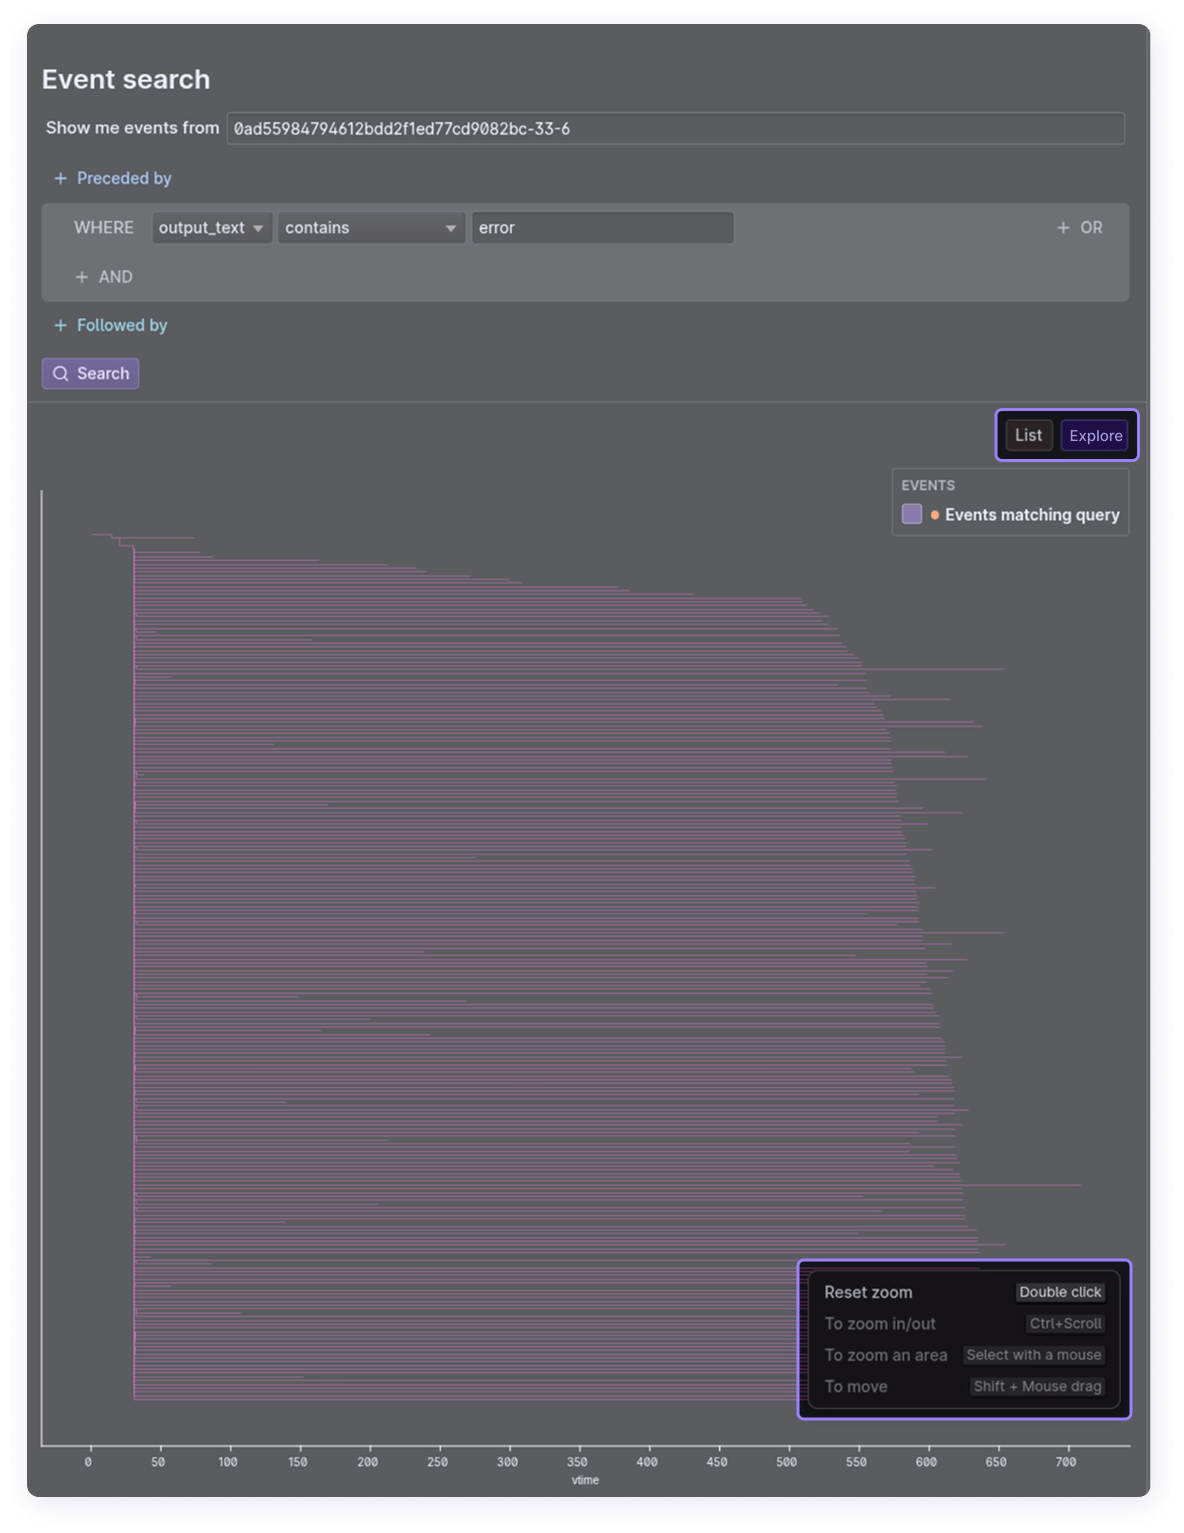
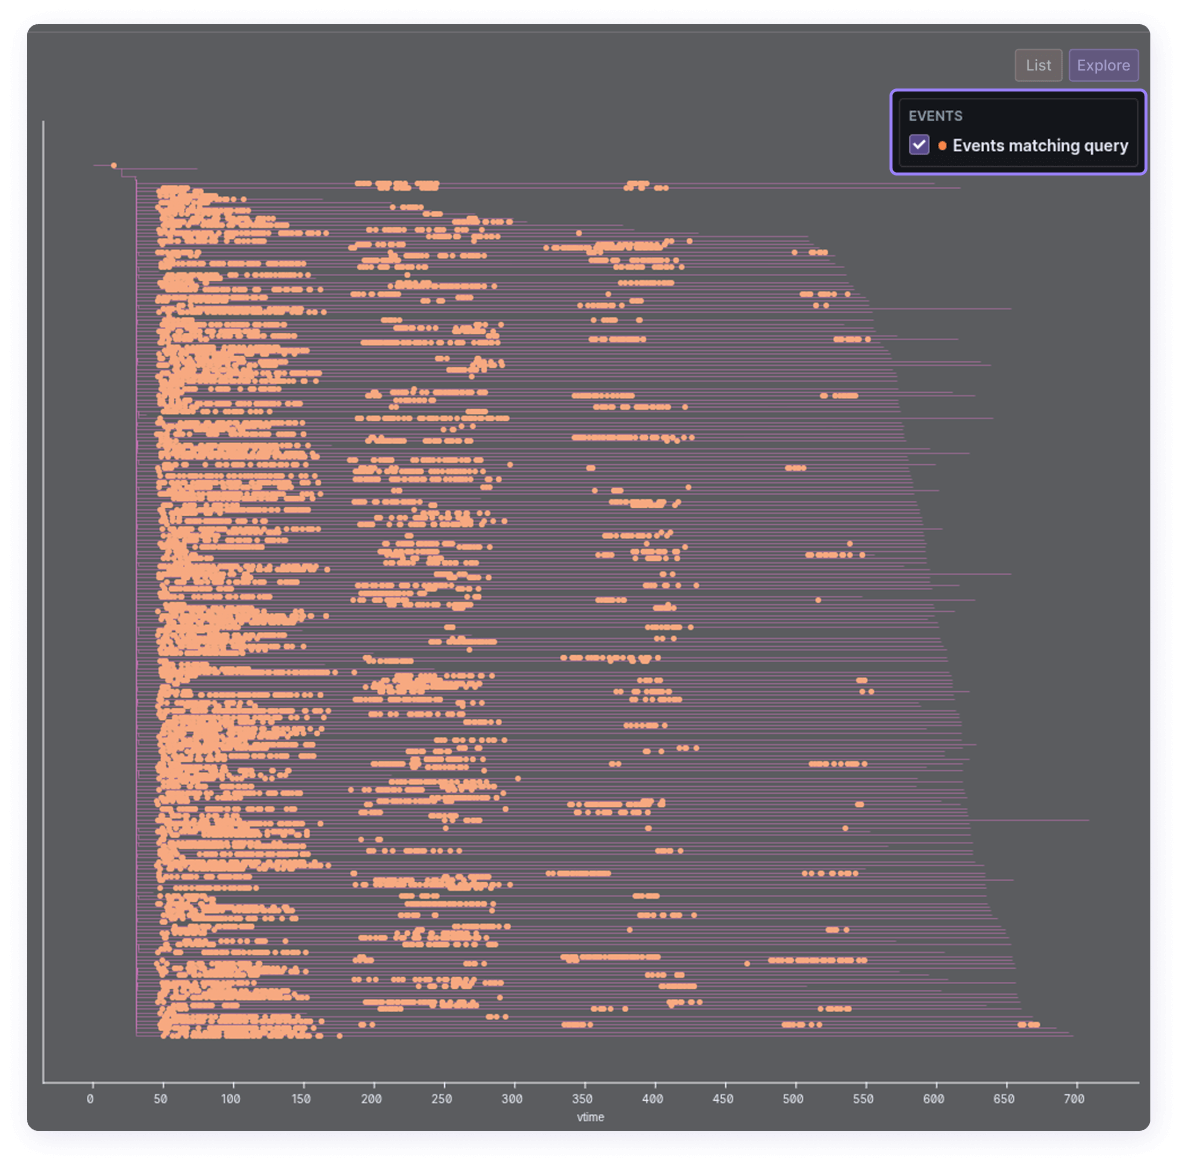
The multiverse map
The multiverse map is a visualization of a complete Antithesis test run. After starting a search, switch to theMap tab on the event search for this view (you’ll need to click search to make this render). Right click on the explorer for zoom and view options.
Common workflows
Investigate something you saw in production
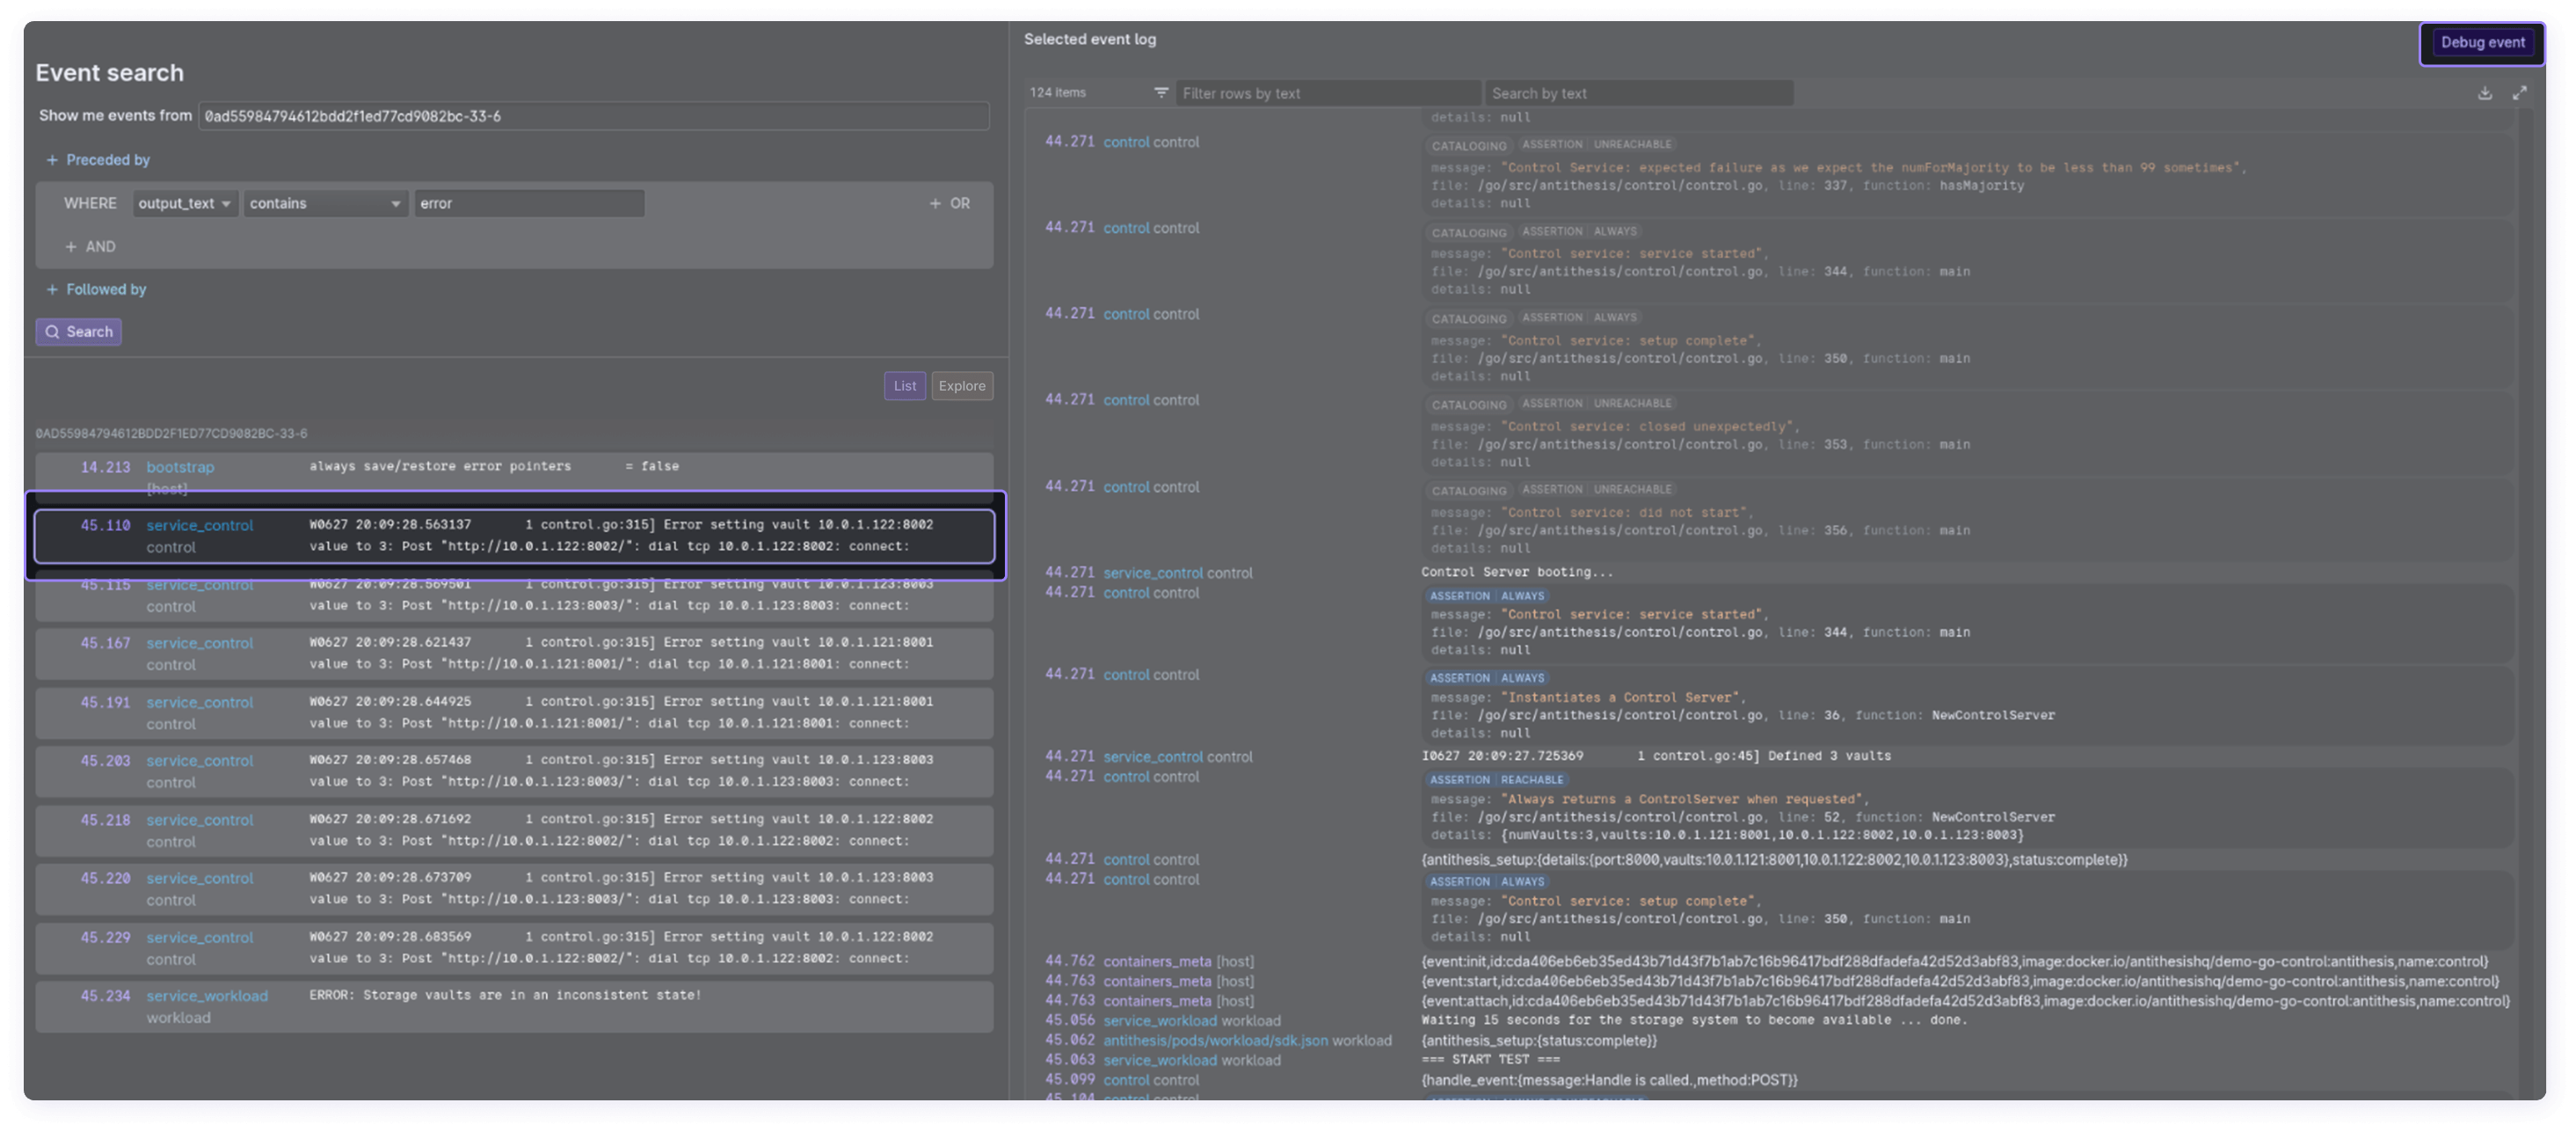
Use case: You saw an ominous log line in production but didn’t have enough information to troubleshoot. Antithesis runs your software in a simulation that’s much more hostile than production, and doing so in massively parallel fashion. Therefore, any rare event you encounter in production very likely appears multiple times in an Antithesis test run, making it easier to investigate and debug. You can search for any line from your production logs, and layer in additional searches to reveal correlations with other events. Temporal relationships, whereevent X is PRECEDED_BY event A or event X is NOT PRECEDED_BY event B, can be especially helpful.
To debug further you can launch a multiverse debugging session and replay the bug as it happens in the test run.
You can (and really should) also convert the event to a test property so future test runs will return a finding if it fails – either using our SDKs, or by talking to one of our customer success engineers.